Conscious weather — an art project about relativity of climate change
My role
Concept
UX/UI
Web Dev
Art
Tools

Figma

React

Styled Components
Task
To make an art project on climate change that involves open data sets or APIs
Result
Not a result, but rather a next step is to adjust this project for exhibiting

About
A study project from the 'Understanding Data' course at Interaction Design MA at MOME. I needed to come up with a concept about non-trivial data representation of climate change. After some ideation, I decided to go with real-time weather data.
Process
Ideation and first prototype

First prototype
Design

Interface design
Development

The main component rendering and handling the weather app
Ideation and first prototype
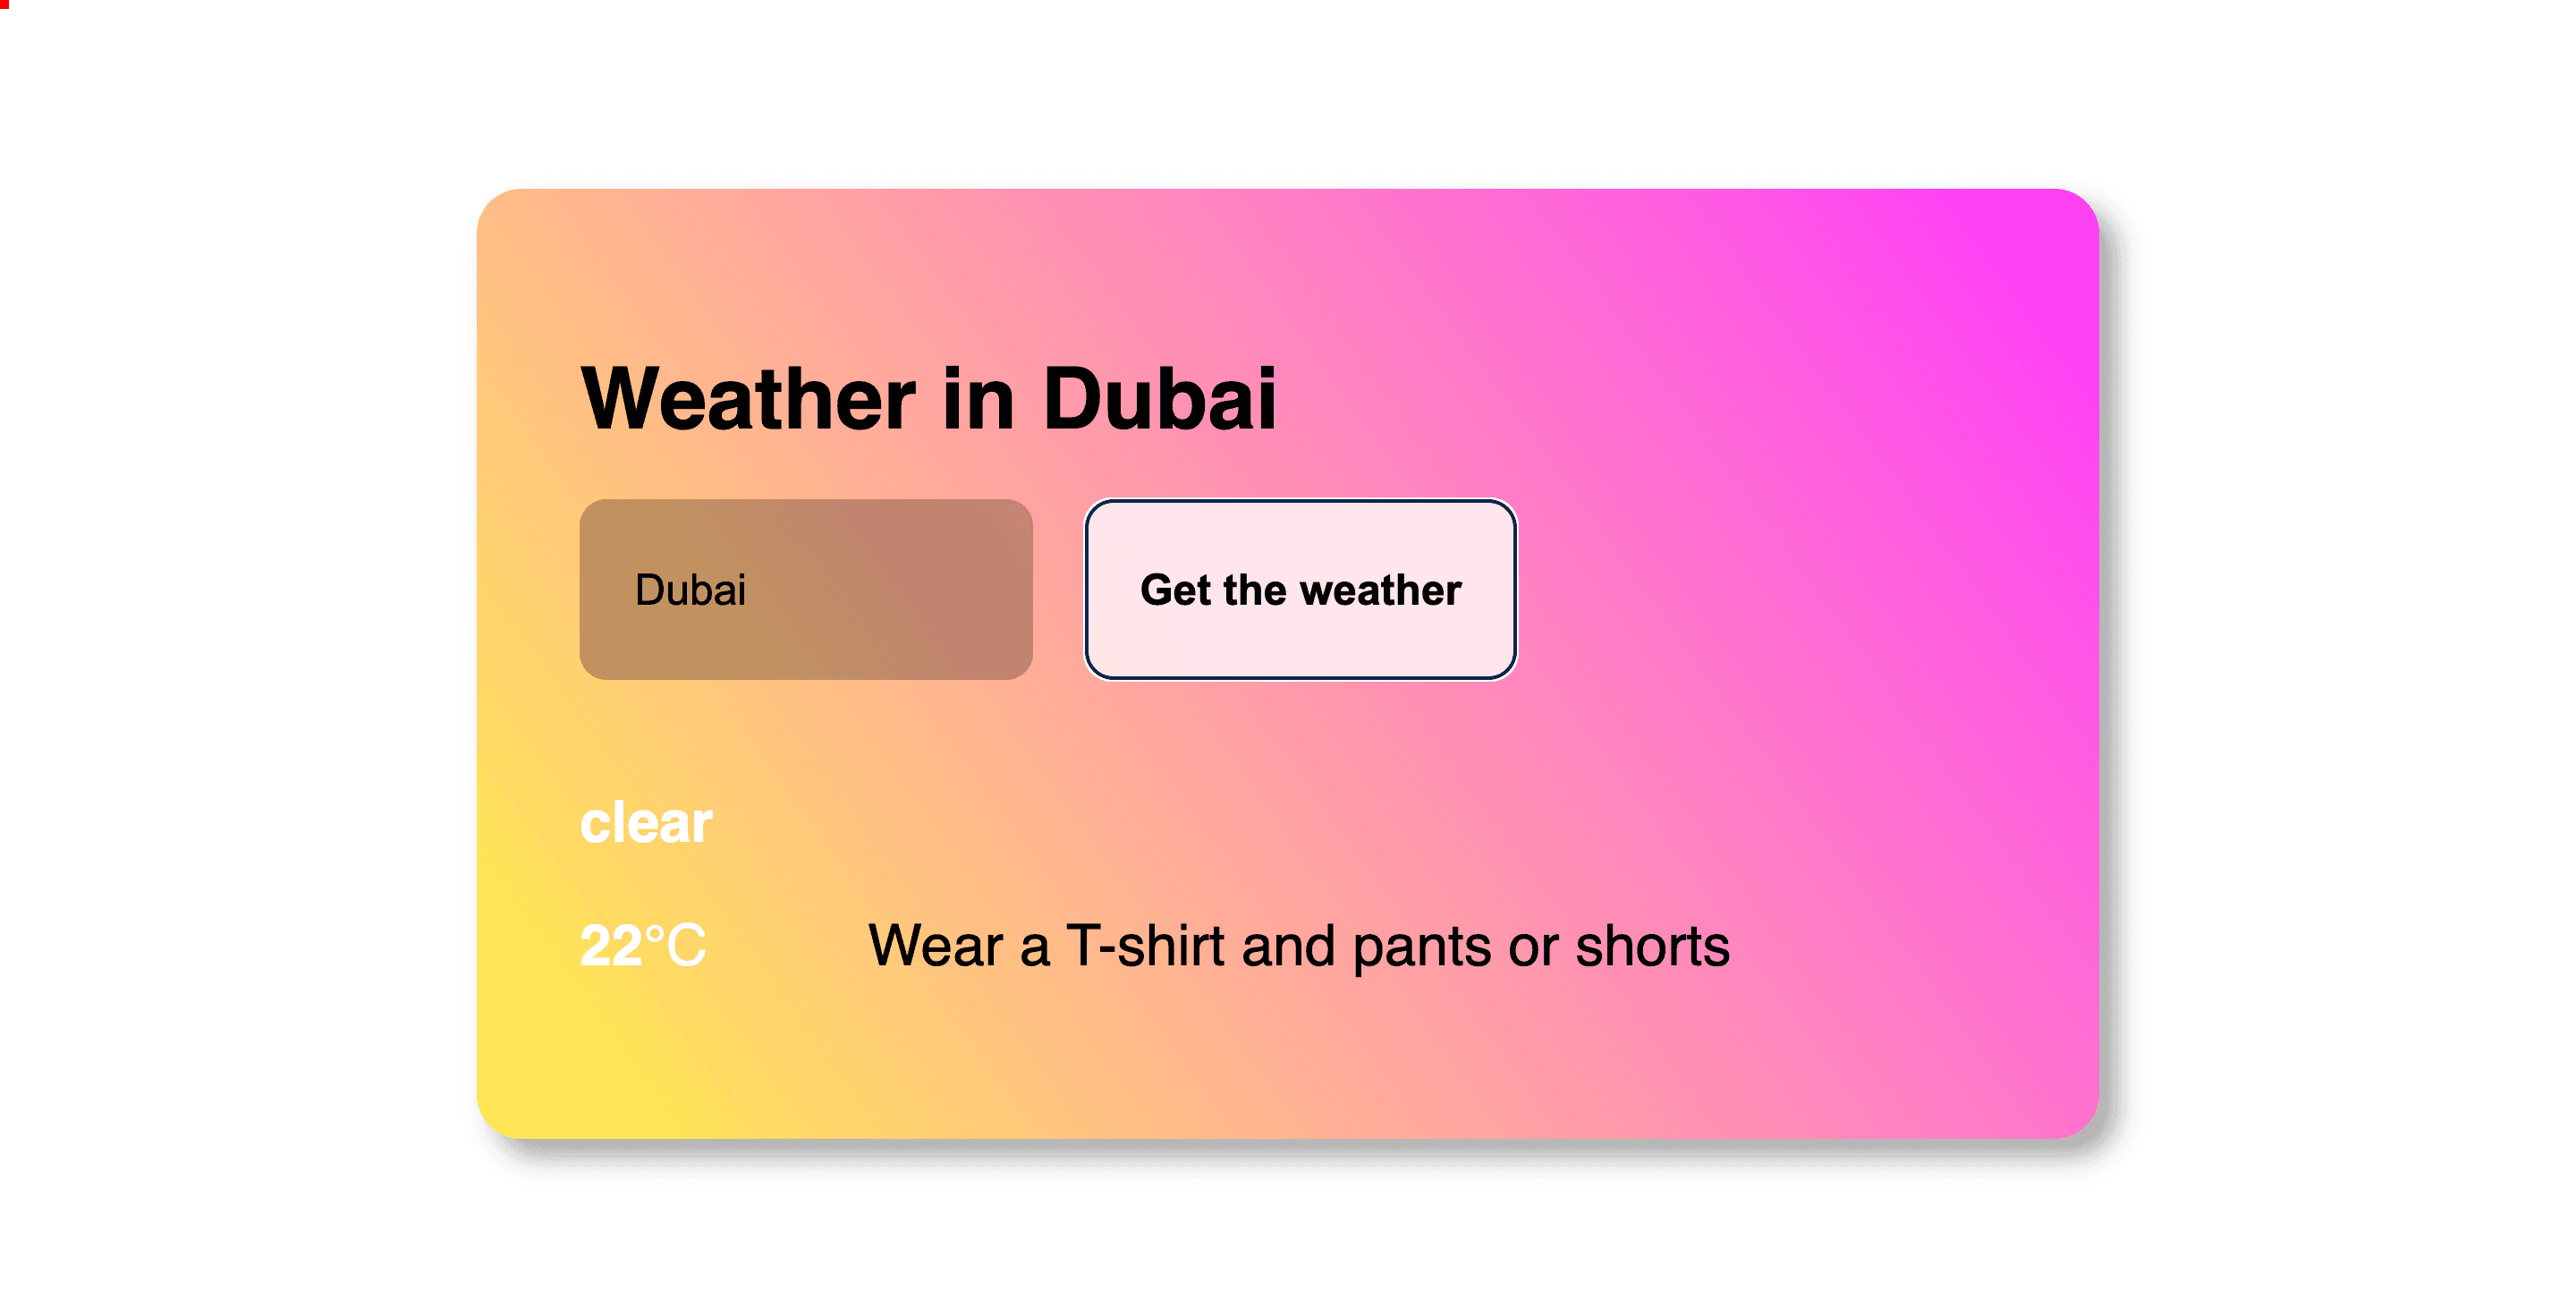
After desk research, I wanted to look for correlation between mobile phone concentration in a particular area and extreme weather events. However, data on that matter proved to be either inexistent or irrelevant. And at one of the critique sessions, I showed a simple interface for querying current weather written in HTML and vanilla JavaScript. That prototype had strong colors as temperature indicators. Fellow designers suggested to make accent on the emotional aspect of weather representation. And that triggered me to derive emotional informational display from comparison of temperatures over a time scale rather than from a current snapshot.

First prototype
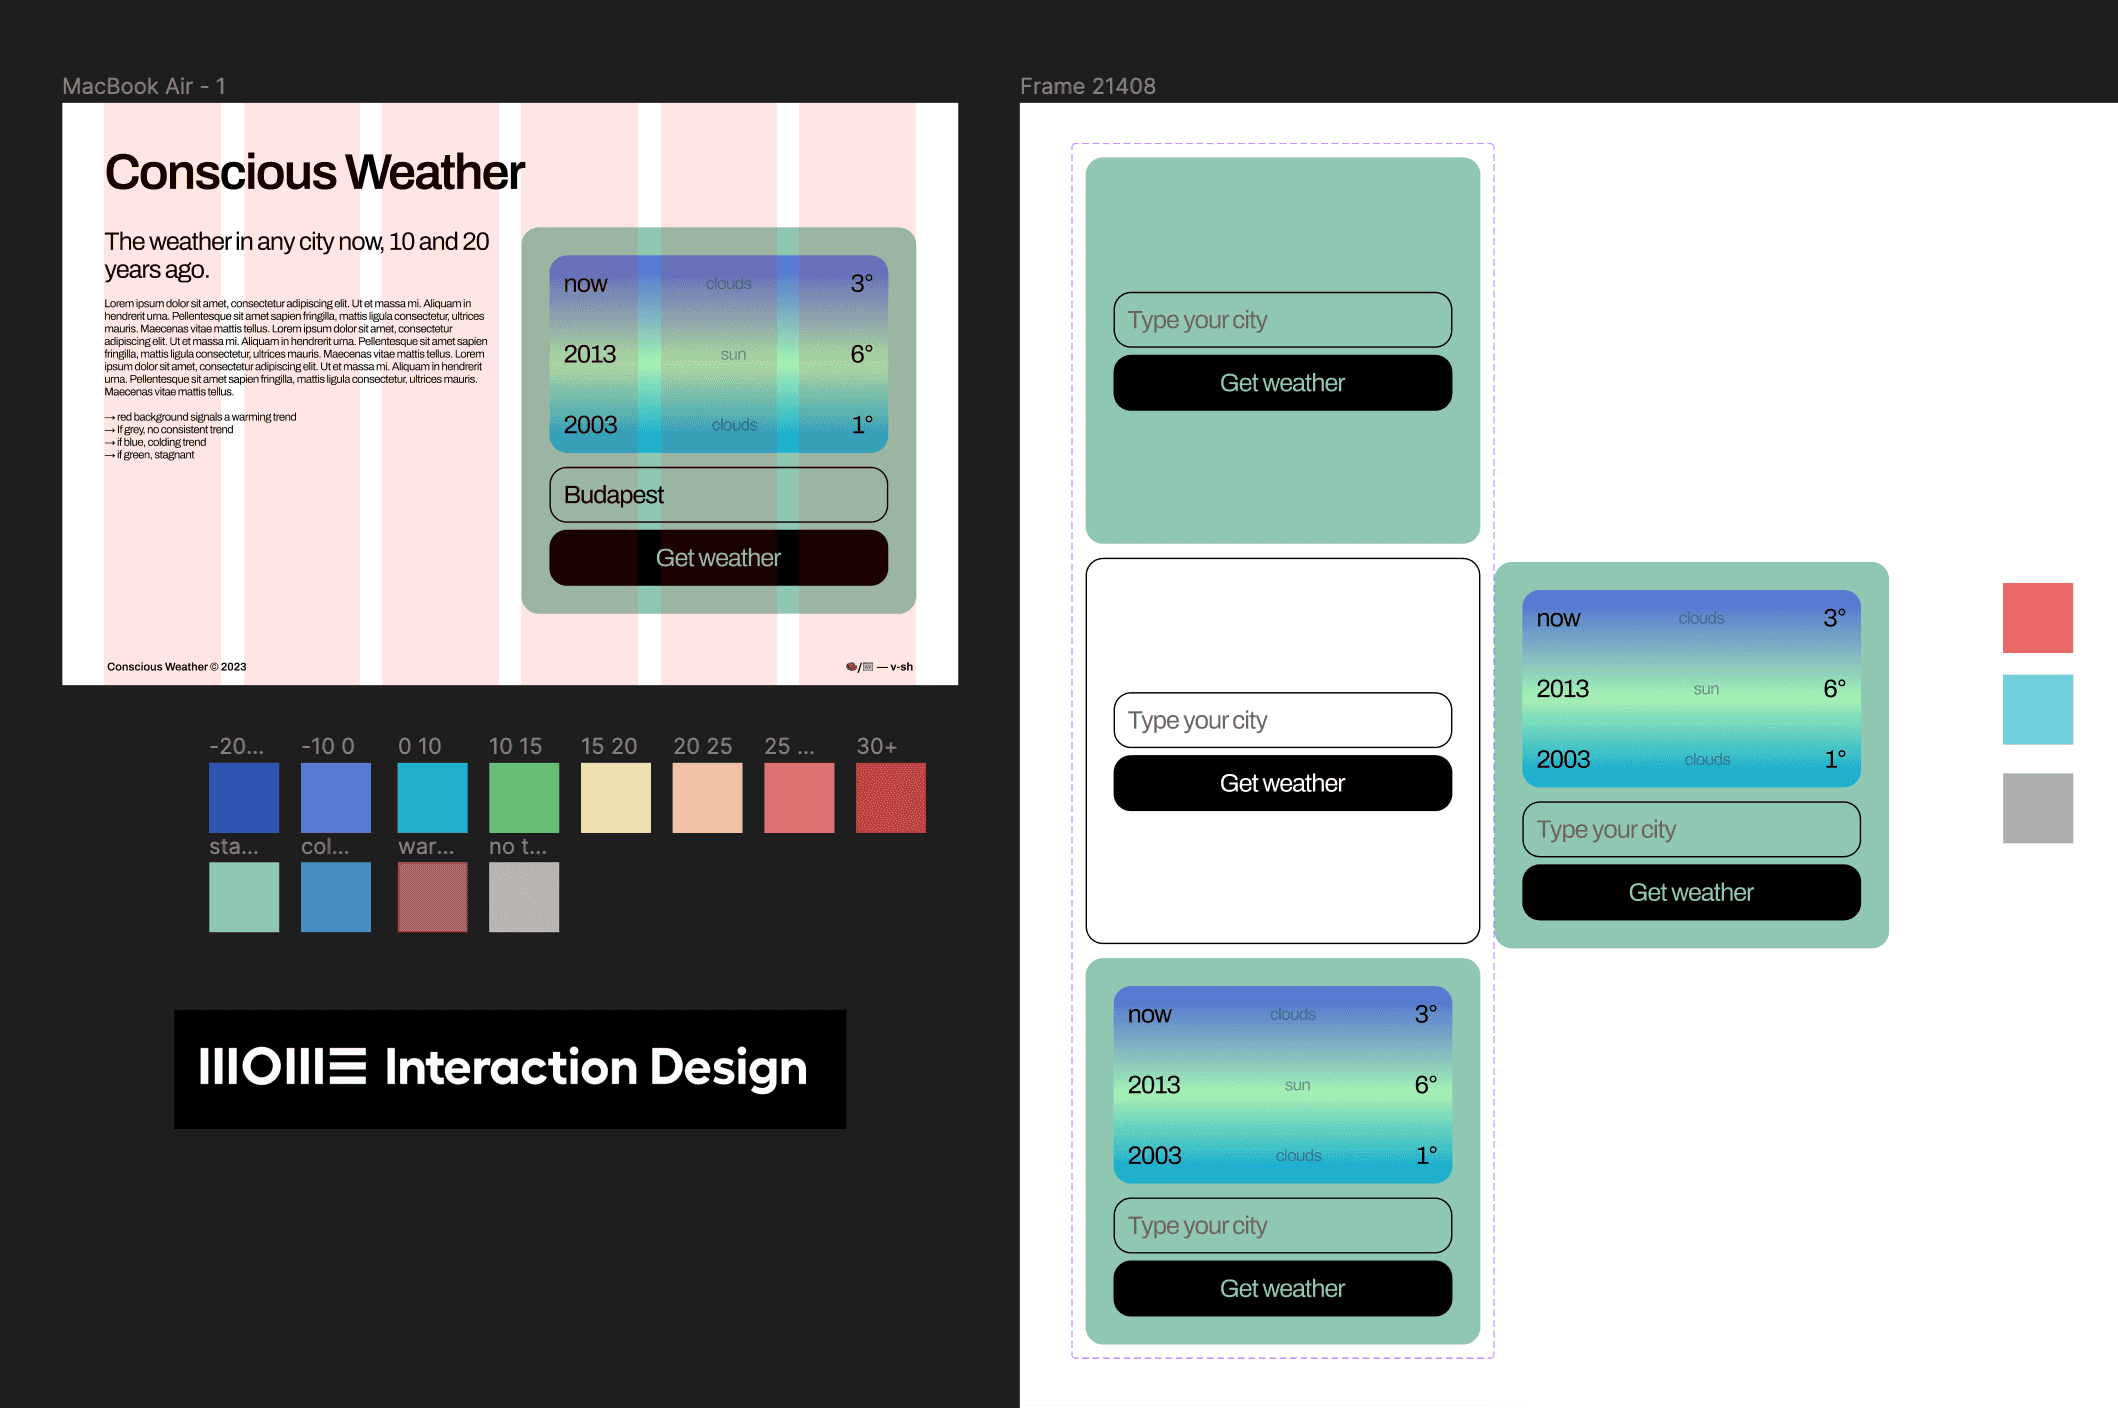
Design
The final interface shows two dimensions of data: temperature in a city entered by user now, ten and twenty years ago and the trend—whether it has become colder, hotter or remained stagnant ever since. I was inspired by Edward Tufte's classic 'The Visual Display of Quantitative information' to make a concise yet eloquent data representation.

Interface design
Development
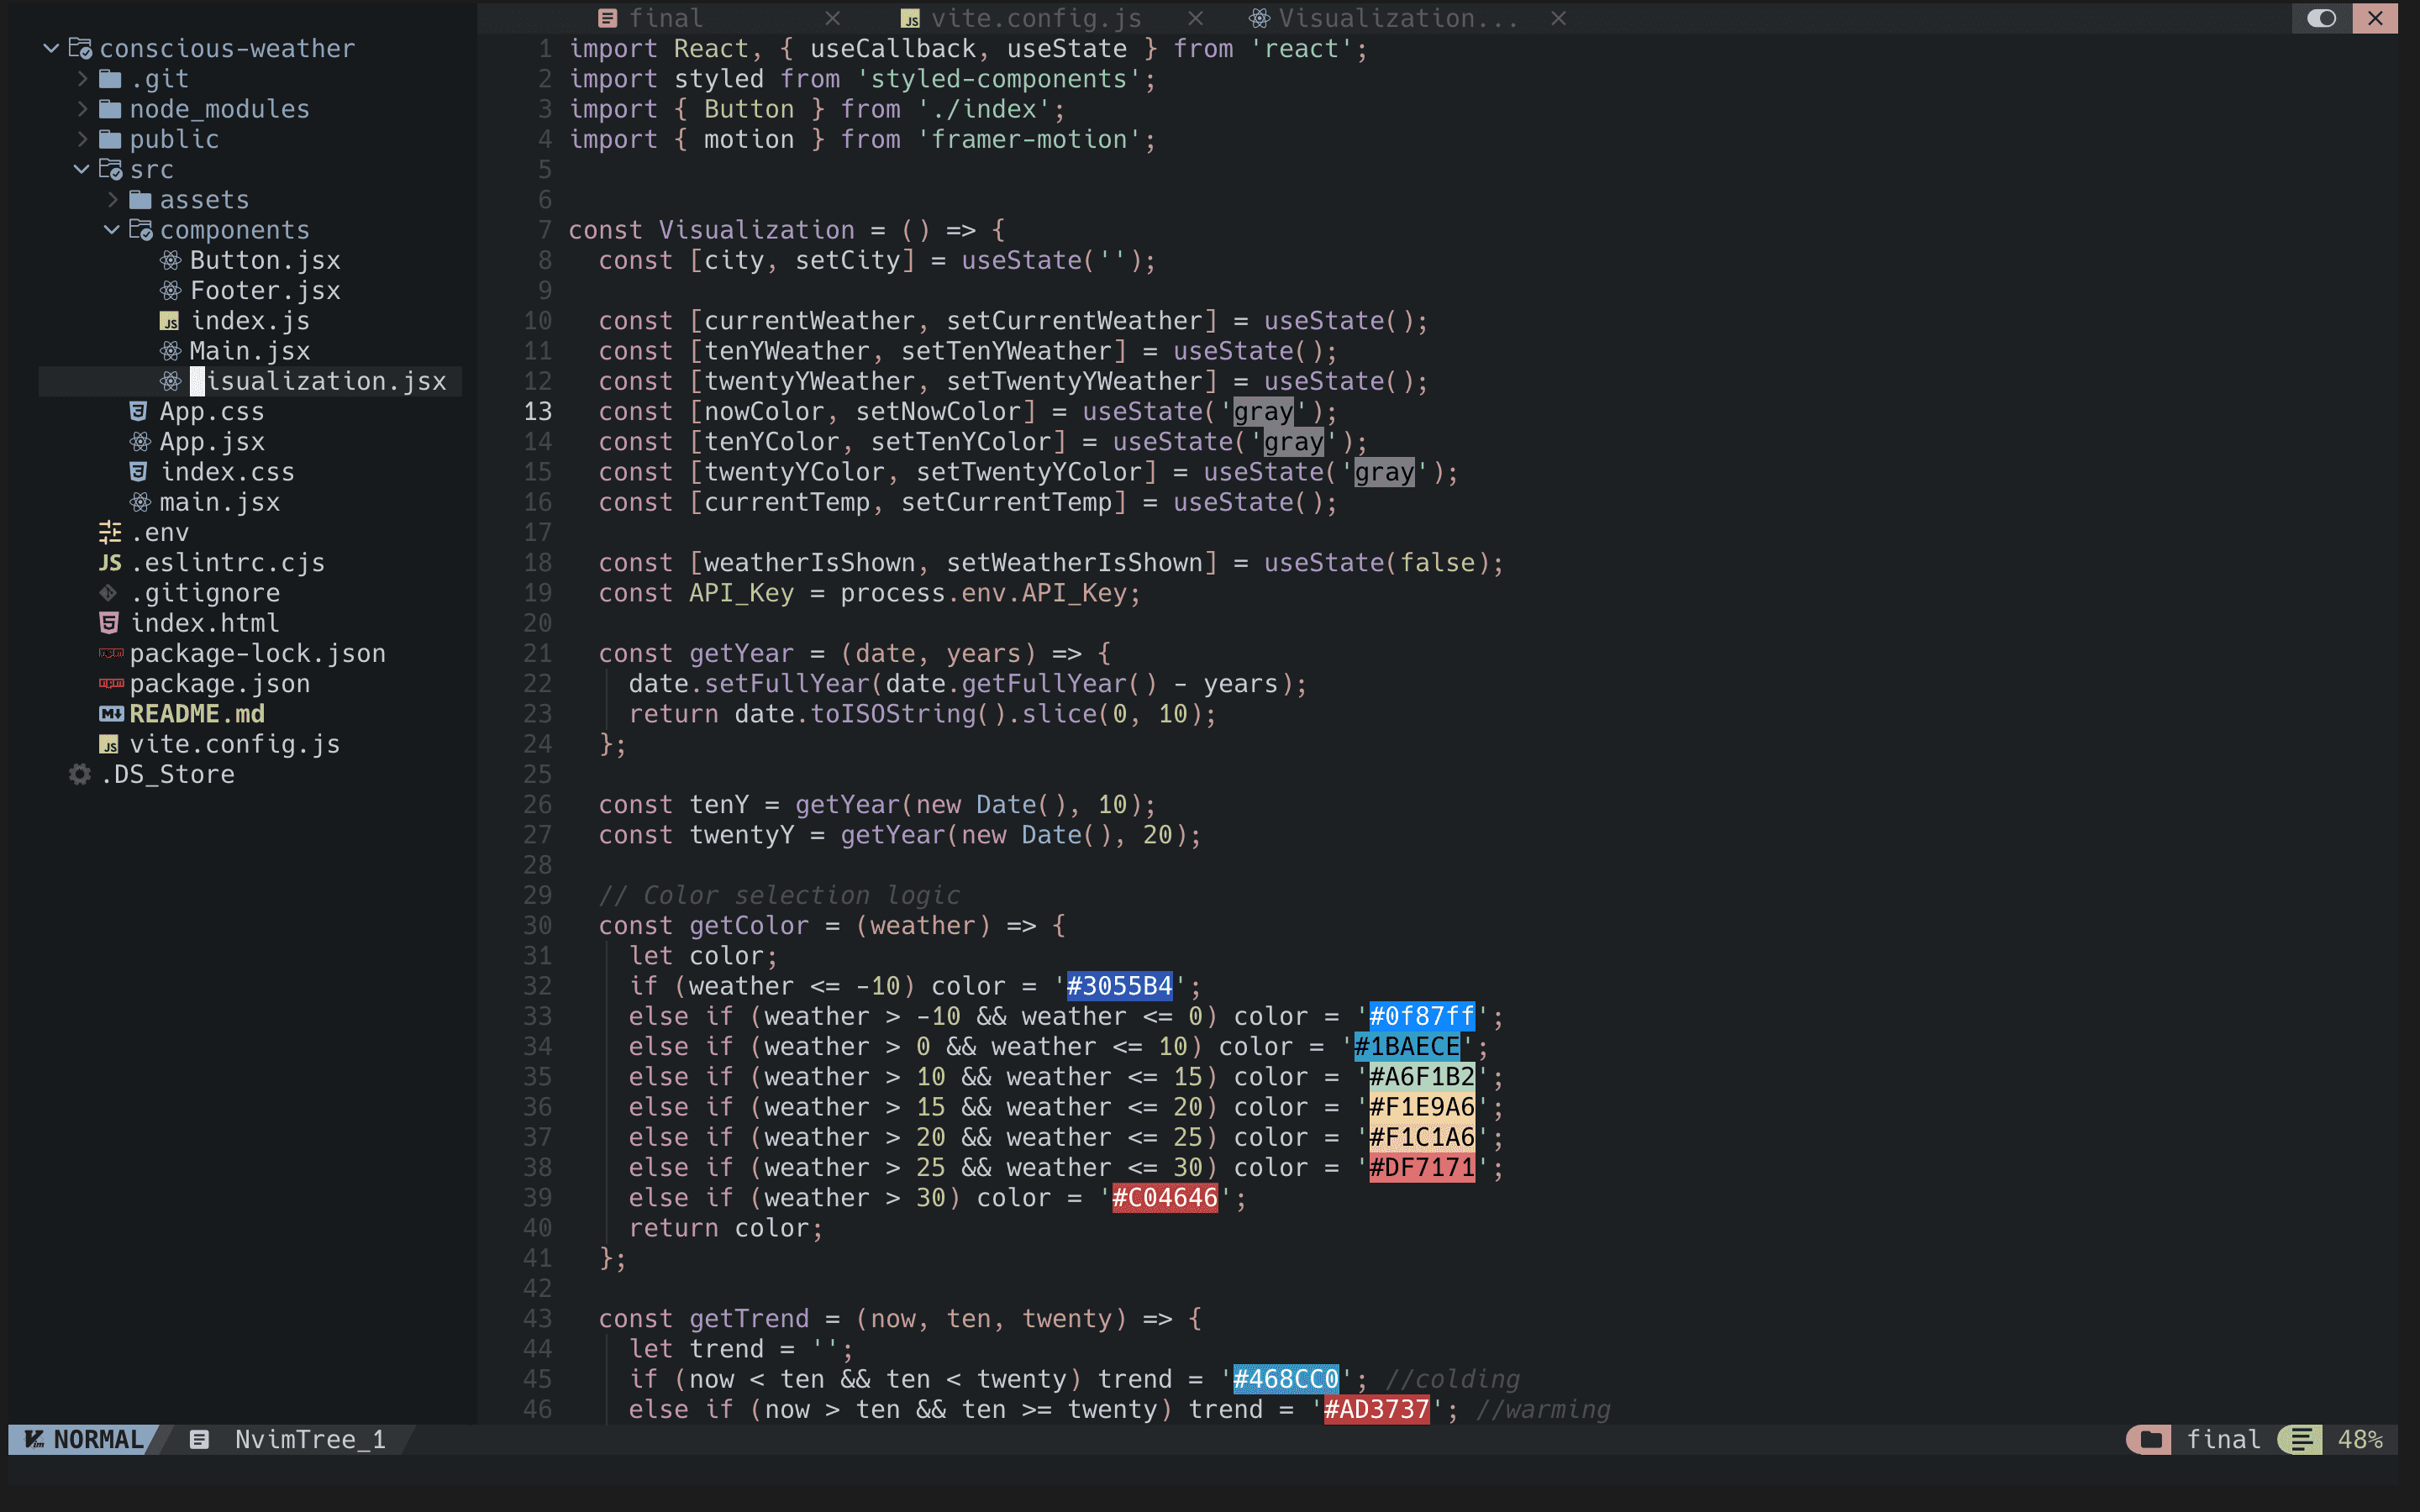
I used OpenWeatherMap's API to make two types of queries: for current weather and historical one. The project uses three (nested) acynchronous fetch functions (you can look at those in the 'Visualization' component in the project's GitHub, link to which is in the page title). Such a decision was made to accommodate the visual display of the delays between queries. And yes, it was my first project written in Neovim which I am now a huge fan of 🙃.

The main component rendering and handling the weather app